Is 25% body fat good for a woman? For most women, yes. A female body fat chart by age, what 21% to 38% mean, and why the range starts higher for Asian women.
October 11, 2026 · 9 min read
“My scan says 25% body fat. Is that good for a woman?”
For most women aged 20 to 79, yes. 25% sits inside the healthy range in the most-used research chart, and at the start of the “average” band on the American Council on Exercise chart that gyms and scans print on your report.
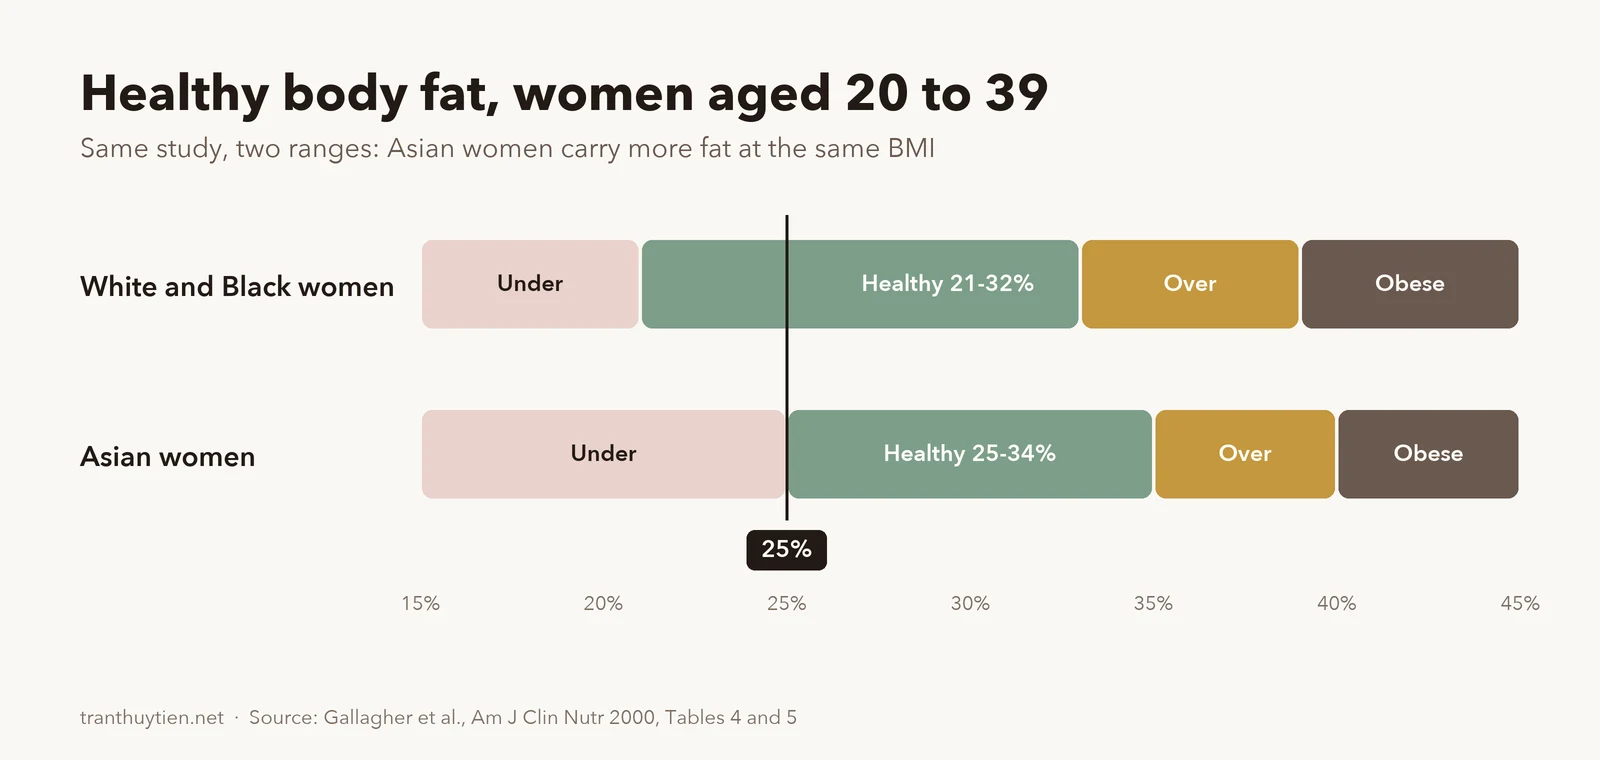
One detail shifts the picture for many of our readers: in that same research, the healthy range for Asian women starts at about 25%, not 21%.
A body fat number only means something next to your age, your sex and your background.
Quick answer
Women, 20 to 39: healthy range about 21-32%. For Asian women, about 25-34%.
Men, 20 to 39: about 8-19%. For Asian men, about 13-22%.
25% for a woman: healthy at ages 20 to 79. Not athlete lean, not high.
The range rises with age. The same number reads differently at 30 and at 65.
Hong Phan, in Oregon, used to skip breakfast and cut carbs until she felt dizzy. The scale still wouldn’t move.
In the program the goal wasn’t to cut more. She went back to full meals with protein, carbs and fat, and paid attention to portions across the day.
After 8 weeks she was down 20 pounds.
Real Young Group client results, shared with consent. These are individual outcomes, not typical or average results. Results vary by person, and this is not medical advice.
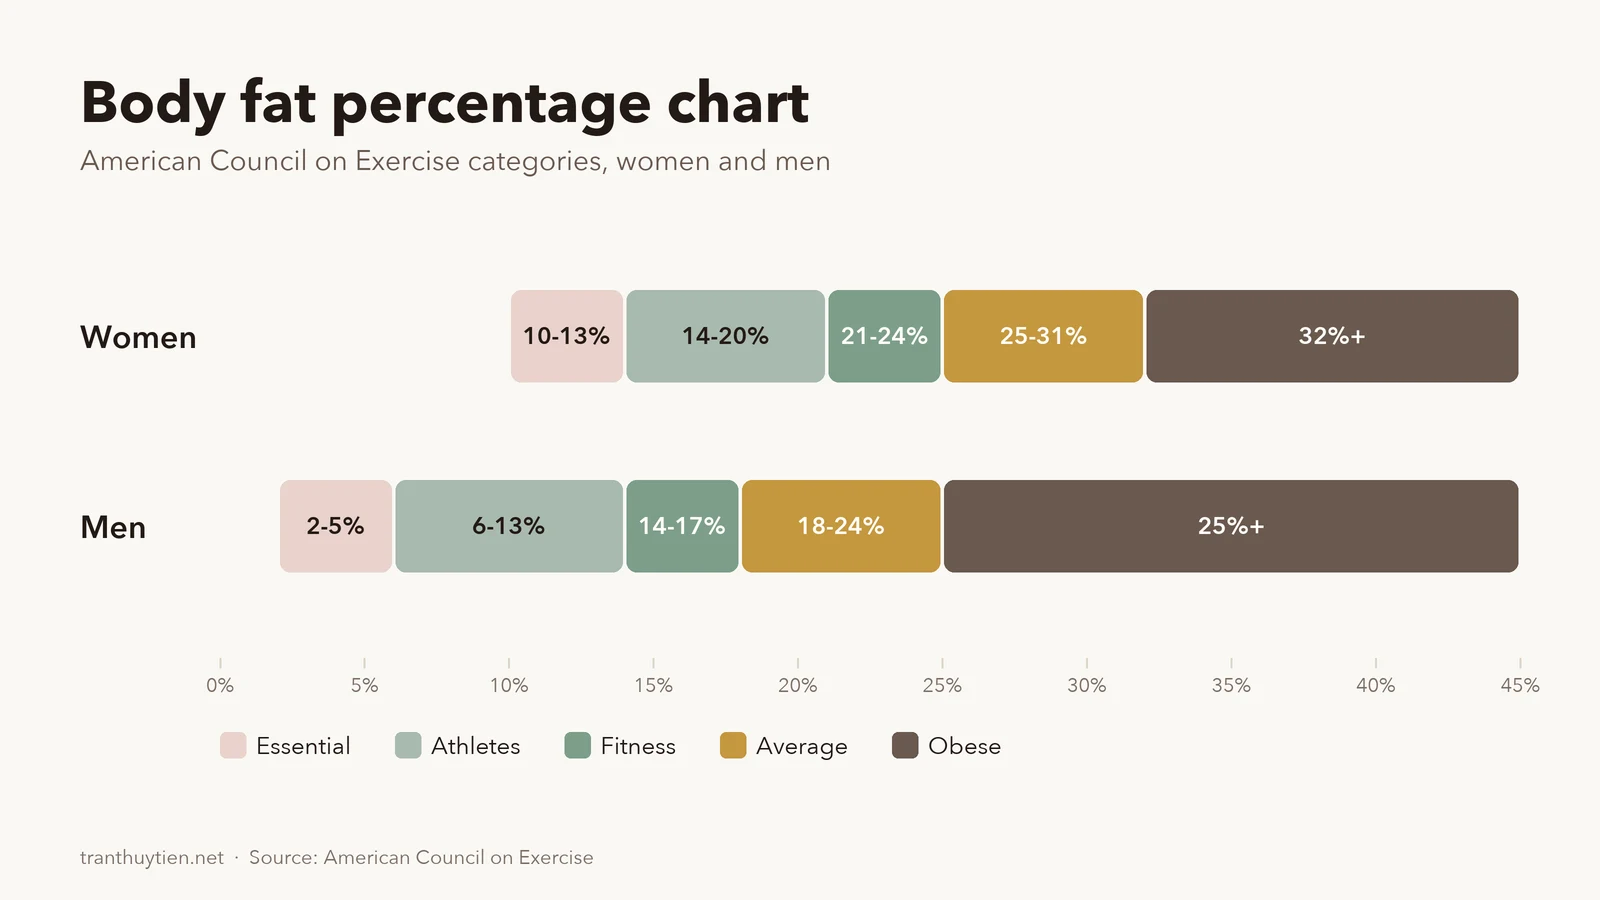
This is the chart most people have seen. The American Council on Exercise (ACE) sorts body fat into five bands. Women’s bands sit higher because women carry more essential fat for hormones and reproduction.
The ACE chart has one blind spot: it ignores age. A 25-year-old and a 65-year-old at 30% get the same label. The next chart fixes that.
What is a healthy body fat percentage by age?
The most careful attempt comes from Gallagher and colleagues, in the American Journal of Clinical Nutrition (2000). They measured 1,626 adults, then worked out which body fat levels line up with the BMI cutoffs doctors already use.
Age
Women: healthy
Overweight from
Obese from
20-39
21-32%
33%
39%
40-59
23-33%
34%
40%
60-79
24-35%
36%
42%
Age
Men: healthy
Overweight from
Obese from
20-39
8-19%
20%
25%
40-59
11-21%
22%
28%
60-79
13-24%
25%
30%
Source: Gallagher et al., 2000, Table 4, white and African American adults (full paper, PubMed).
How the ranges were made: each one is the body fat the study’s equations predict at BMI 18.5, 25 and 30.
What they are: reference ranges. The authors call them working guidelines, not final cutoffs.
What they are not: a diagnosis, or a number every body must hit.
Why does the healthy range start higher for Asian women?
Same BMI, more body fat. In the same study, Asian adults carried more body fat than white or African American adults at the same BMI.
So the authors gave them separate equations, and the range moved up by about four points for women.
Ranges from Gallagher 2000, estimated from BMI cutoffs. Reference ranges, not medical cutoffs.
Age
Asian women: healthy
Overweight from
Obese from
20-39
25-34%
35%
40%
40-59
25-34%
35%
41%
60-79
25-35%
36%
41%
Asian men: about 13-22% at 20 to 39, 13-23% at 40 to 59, 14-23% at 60 to 79. Source: Gallagher et al., 2000, Table 5 (full paper).
What this means for you:
An Asian woman in her 20s at 23% reads “fitness” on the gym chart, and sits just under this study’s Asian range. That alone is not a problem.
The range starting near 25% does not mean you need at least 25% to be healthy.
The Asian group was Japanese adults measured in Japan. The study does not show whether the same range fits other Asian groups, such as Vietnamese women. Treat it as a direction, not an exact line.
Many women at 25% look fit in clothes, without sharp muscle lines. But there isn’t one look.
Two women at 25% can look very different. Where fat sits depends on genetics, hormones and age.
An hourglass shape at 25% carries more on the hips and thighs. Another woman may carry more around the middle.
25% is not the athlete band, which is why sharp muscle lines usually don’t show.
Where the fat sits matters more for health than the total. Harvard Health notes that a waist of 35 inches or more for women, or 40 inches for men, raises the risk of heart disease and type 2 diabetes, even when weight looks normal.
What 21%, 22%, 26%, 28%, 31% and 36% body fat mean for women
Each row is read for a woman aged 20 to 39, against the ACE chart and the two study ranges above.
Body fat
ACE chart
Study range, 21-32%
Asian range, 25-34%
21%
Fitness
Inside
Under
22%
Fitness
Inside
Under
25%
Average
Inside
Bottom edge
26%
Average
Inside
Inside
28%
Average
Inside
Inside
31%
Average
Top end
Inside
36%
Obese (ACE label)
Overweight
Overweight
38%
Obese (ACE label)
Overweight
Overweight
21-22%: usually the result of regular training. Under the Asian range is not a warning sign by itself.
25-31%: inside both ranges for women under 40.
36%: a 2025 study reported by Harvard Health also puts the overweight line for women at 36%.
38%: one point under the study’s obesity line of 39%.
How to measure your body fat, and which reading to trust
Every method estimates. A smart scale and a DXA scan can read a few points apart on the same morning.
DXA scan: the reference most studies use. Costs money, needs a clinic or scan center.
Bioimpedance (smart scales, InBody): cheap and easy, but moves with how much water you’ve had.
Skinfold calipers: good in trained hands, inconsistent otherwise.
Tape-measure formulas (like the US Navy method): free and rough.
Pick one method and stay with it. Same device, same time of day, month to month. The direction matters more than any single reading.
The free 10-second check: divide your waist by your height, in the same units. Harvard Health gives 0.4 to 0.49 as the healthy range.
Is body fat a better number than BMI?
It tells you more. But there is still no agreed normal range for body fat, the same way there’s no single ideal weight. That’s Harvard Health’s own position.
A 2025 study of US adults aged 18 to 85, reported by Harvard Health, proposed body fat cutoffs in place of BMI: overweight from 36% for women and 25% for men, obesity from 42% and 30%.
Read body fat, waist and weight together, and watch the trend.
Should you lower your body fat percentage?
Not automatically. A higher reading is a prompt to look closer, not a verdict.
Check the device first. Smart scales move with how much water you’ve had, so one high reading may not be fat.
Check your waist. 35 inches or more is the number Harvard Health flags for women.
Check the trend. One reading moving up is noise. Three months moving up is a pattern.
Lower isn’t automatically better. ACE puts essential fat for women at 10-13%, and Harvard Health notes that very low body fat in someone who isn’t training can point to a medical problem.
If the numbers do say it’s time, the plan matters more than the willpower. In our experience, the women we coach rarely stall for lack of discipline. They stall on plans built for someone else’s food, schedule and body.
Your number, in context
A body fat number only means something next to your age, your sex and your background. For most women, 25% is healthy. For Asian women, it’s where this study’s healthy range begins.
Curious how many calories your body uses in a day? Try the TDEE calculator.
Want to change your body composition without giving up rice, phở or family dinners? Young Group coaches 1-on-1 in English and Vietnamese, around the food you already eat. See how our weight loss coach program works, or book a free consult.
The free consult takes about 15 minutes, on Messenger, Zalo or by phone. We learn about your body and situation, then suggest a few ways to start. No obligation to sign up. You also get a free seat in one of Tiên’s Zoom sessions (she runs two a week).
This is general information, not medical advice. Talk to your doctor about your own numbers.
Frequently asked questions
Is 25% body fat healthy for a 50-year-old woman?
Yes, by the most-used research ranges. For women aged 40 to 59, Gallagher’s study puts the healthy range at about 23-33%, and about 25-34% for Asian women. Harvard Health notes that body fat tends to rise with age, partly because muscle declines, so 25% is inside both ranges at 50. Check your waist alongside it.
What if my body fat is high but my BMI is normal?
It happens, and BMI alone would miss it. Harvard Health points to the waist as the next check: 35 inches or more for women raises the risk of heart disease and type 2 diabetes, even at a normal weight. A waist-to-height ratio of 0.4 to 0.49 is the healthy range. Talk to your doctor about your numbers.
Can you see abs at 25% body fat?
Usually not sharply. 25% is the start of the ACE average band, and visible ab lines tend to show at leaner, athlete-level body fat. How much shows also depends on muscle and on where your body stores fat, so two women at 25% can look quite different.
What is the lowest body fat a woman can have?
The American Council on Exercise puts essential fat for women at 10-13%, the amount the body needs for hormones and basic function. Going below that isn’t a goal. Harvard Health notes that very low body fat in someone who isn’t training can signal a medical problem worth checking with a doctor.
Is 25% body fat good for a man?
It’s on the high side. ACE puts 25% in its obese band for men, and a 2025 study reported by Harvard Health uses 25% as the overweight line for men. For men aged 20 to 39, Gallagher’s healthy range is about 8-19%, or about 13-22% for Asian men.
Written by
Trần Thủy Tiên
Founder of Young Group and author of Béo Ơi Vĩnh Biệt. She built the 1-on-1 coaching method the team uses, personally selects and trains every coach, and coaches clients in the US, Australia, Canada, Germany, the UK and Vietnam.